Digital Visualisation
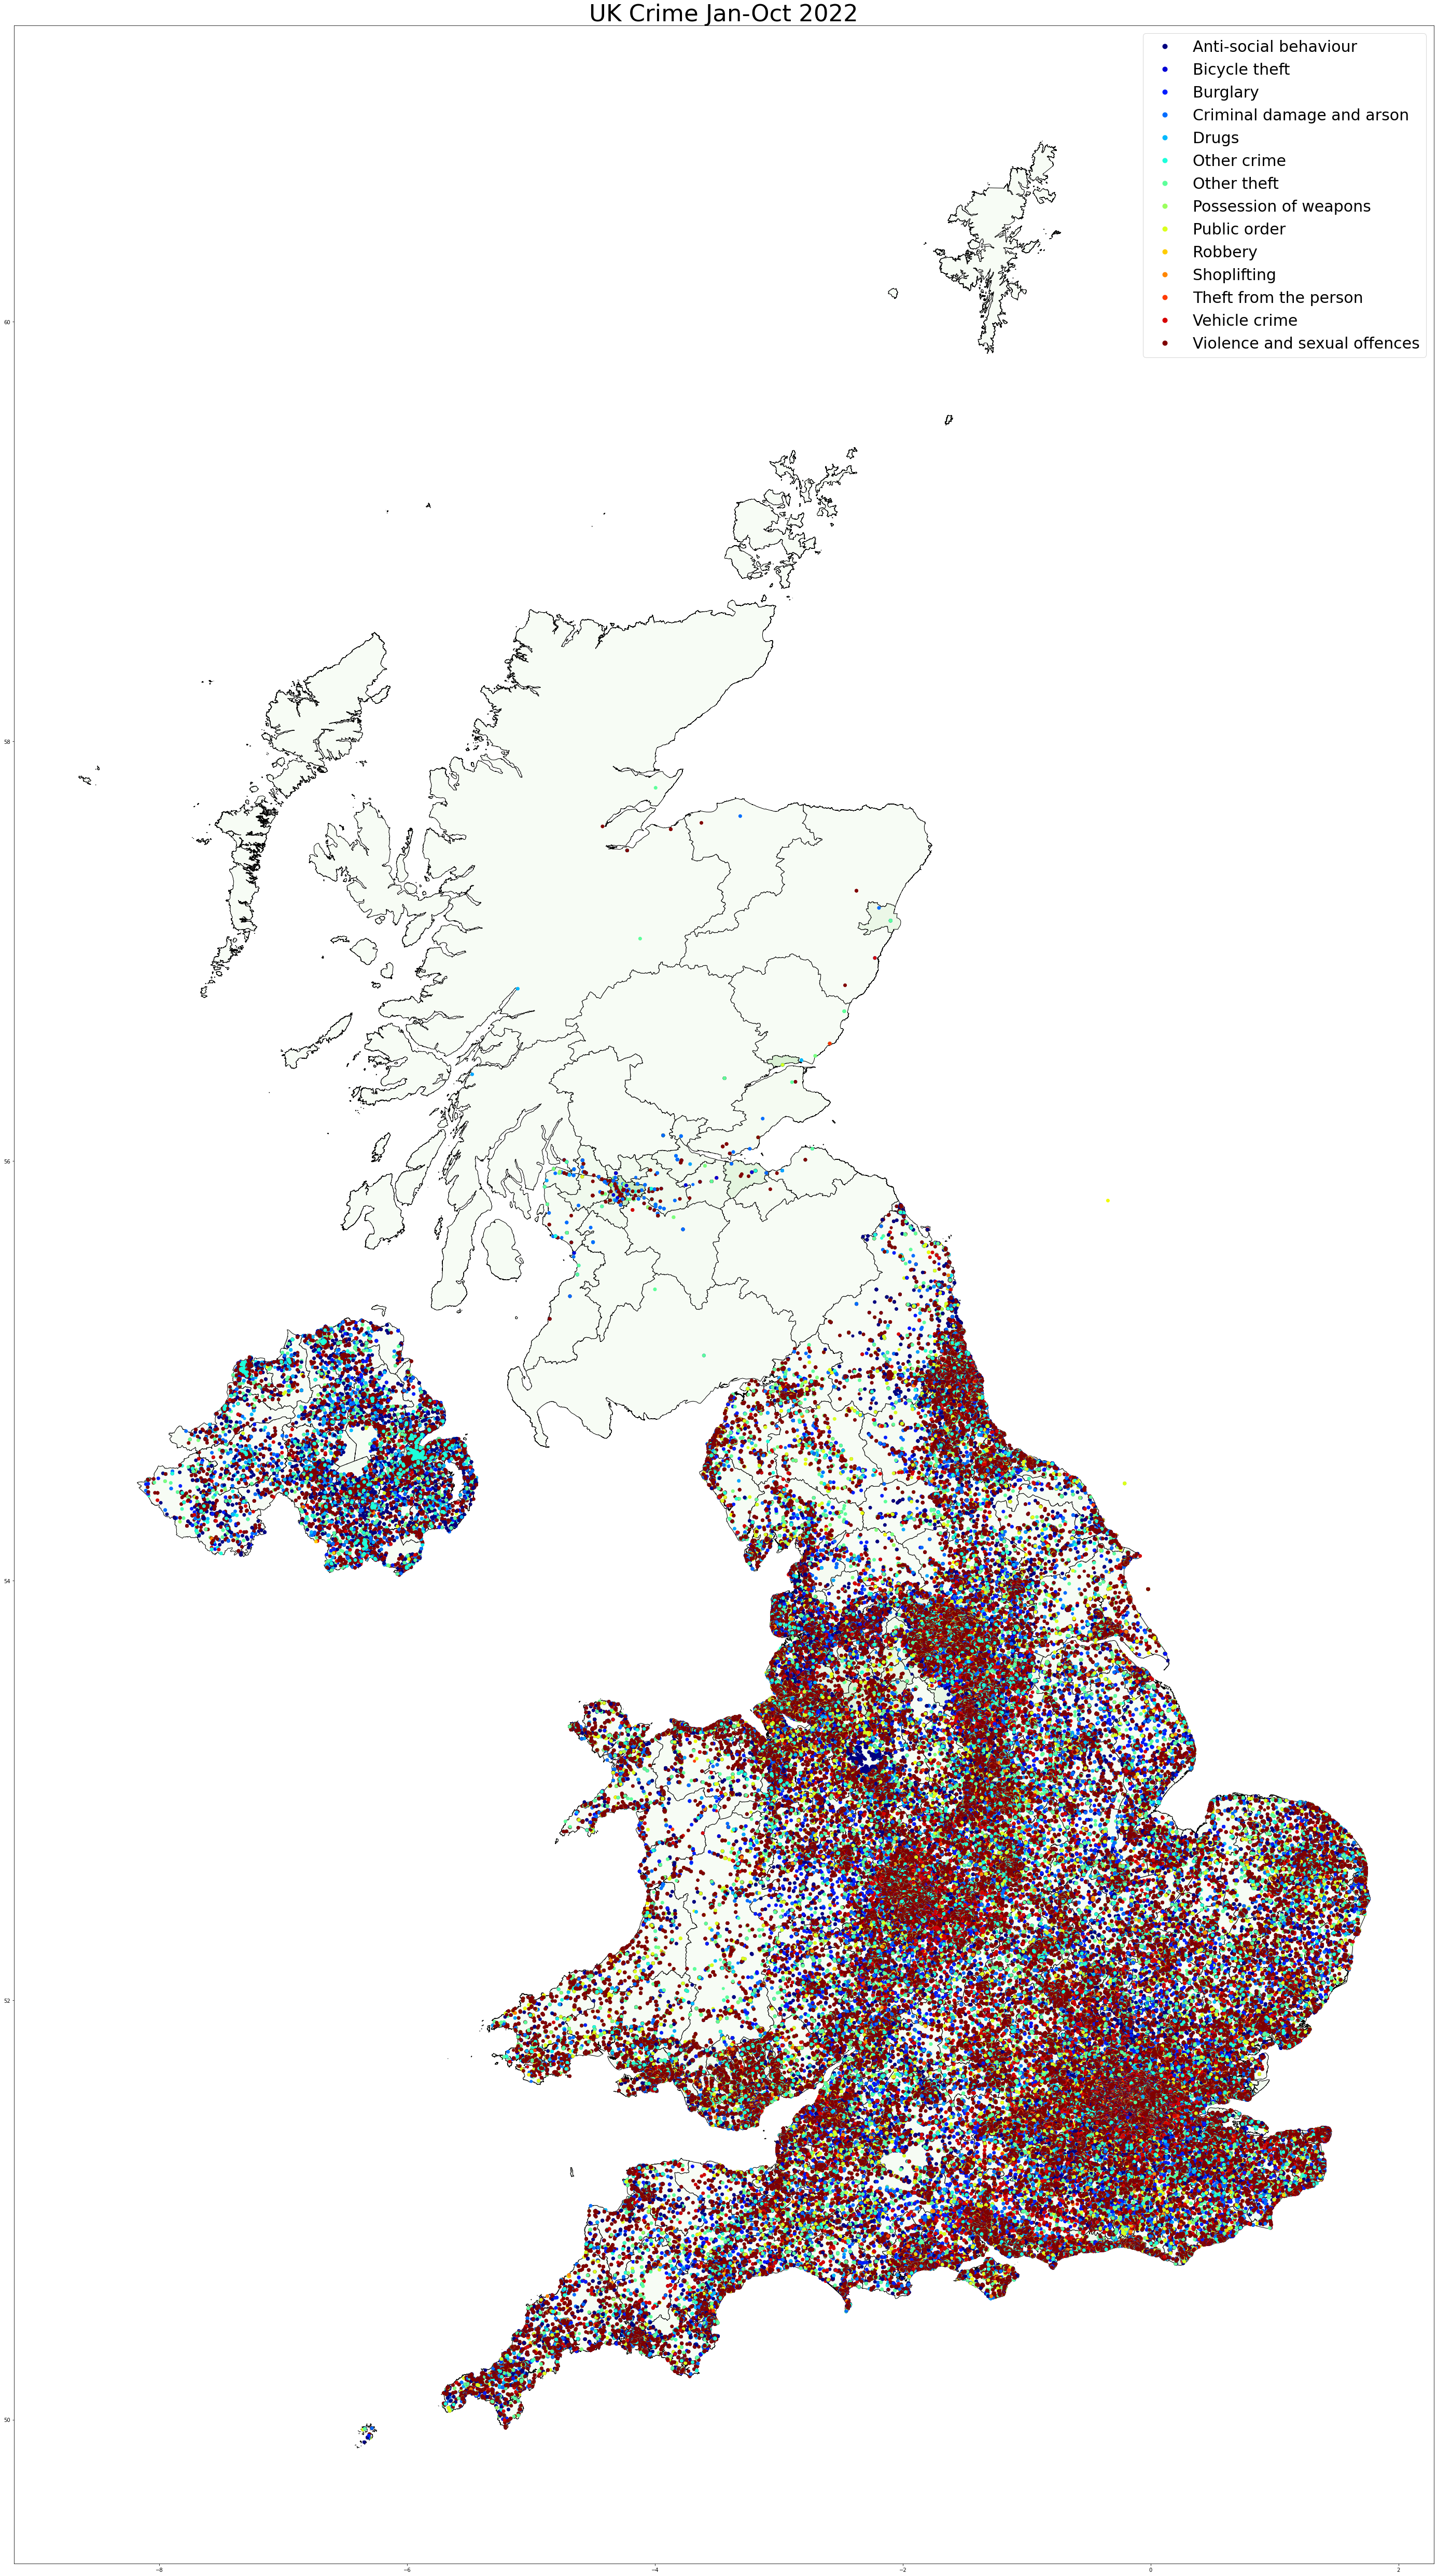
Data of crimes reported January-October 2022.
This data displays over 5,000,000 crimes as recorded by local authorities.
Scottish data isn't included, however data from the British Transport Police is visible.
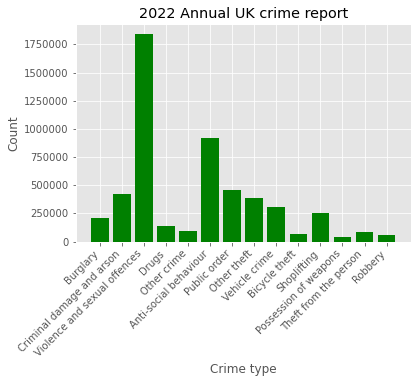
Figure 1
Bar chart of crimes
Further visualisation of the
data presented within figure 1.
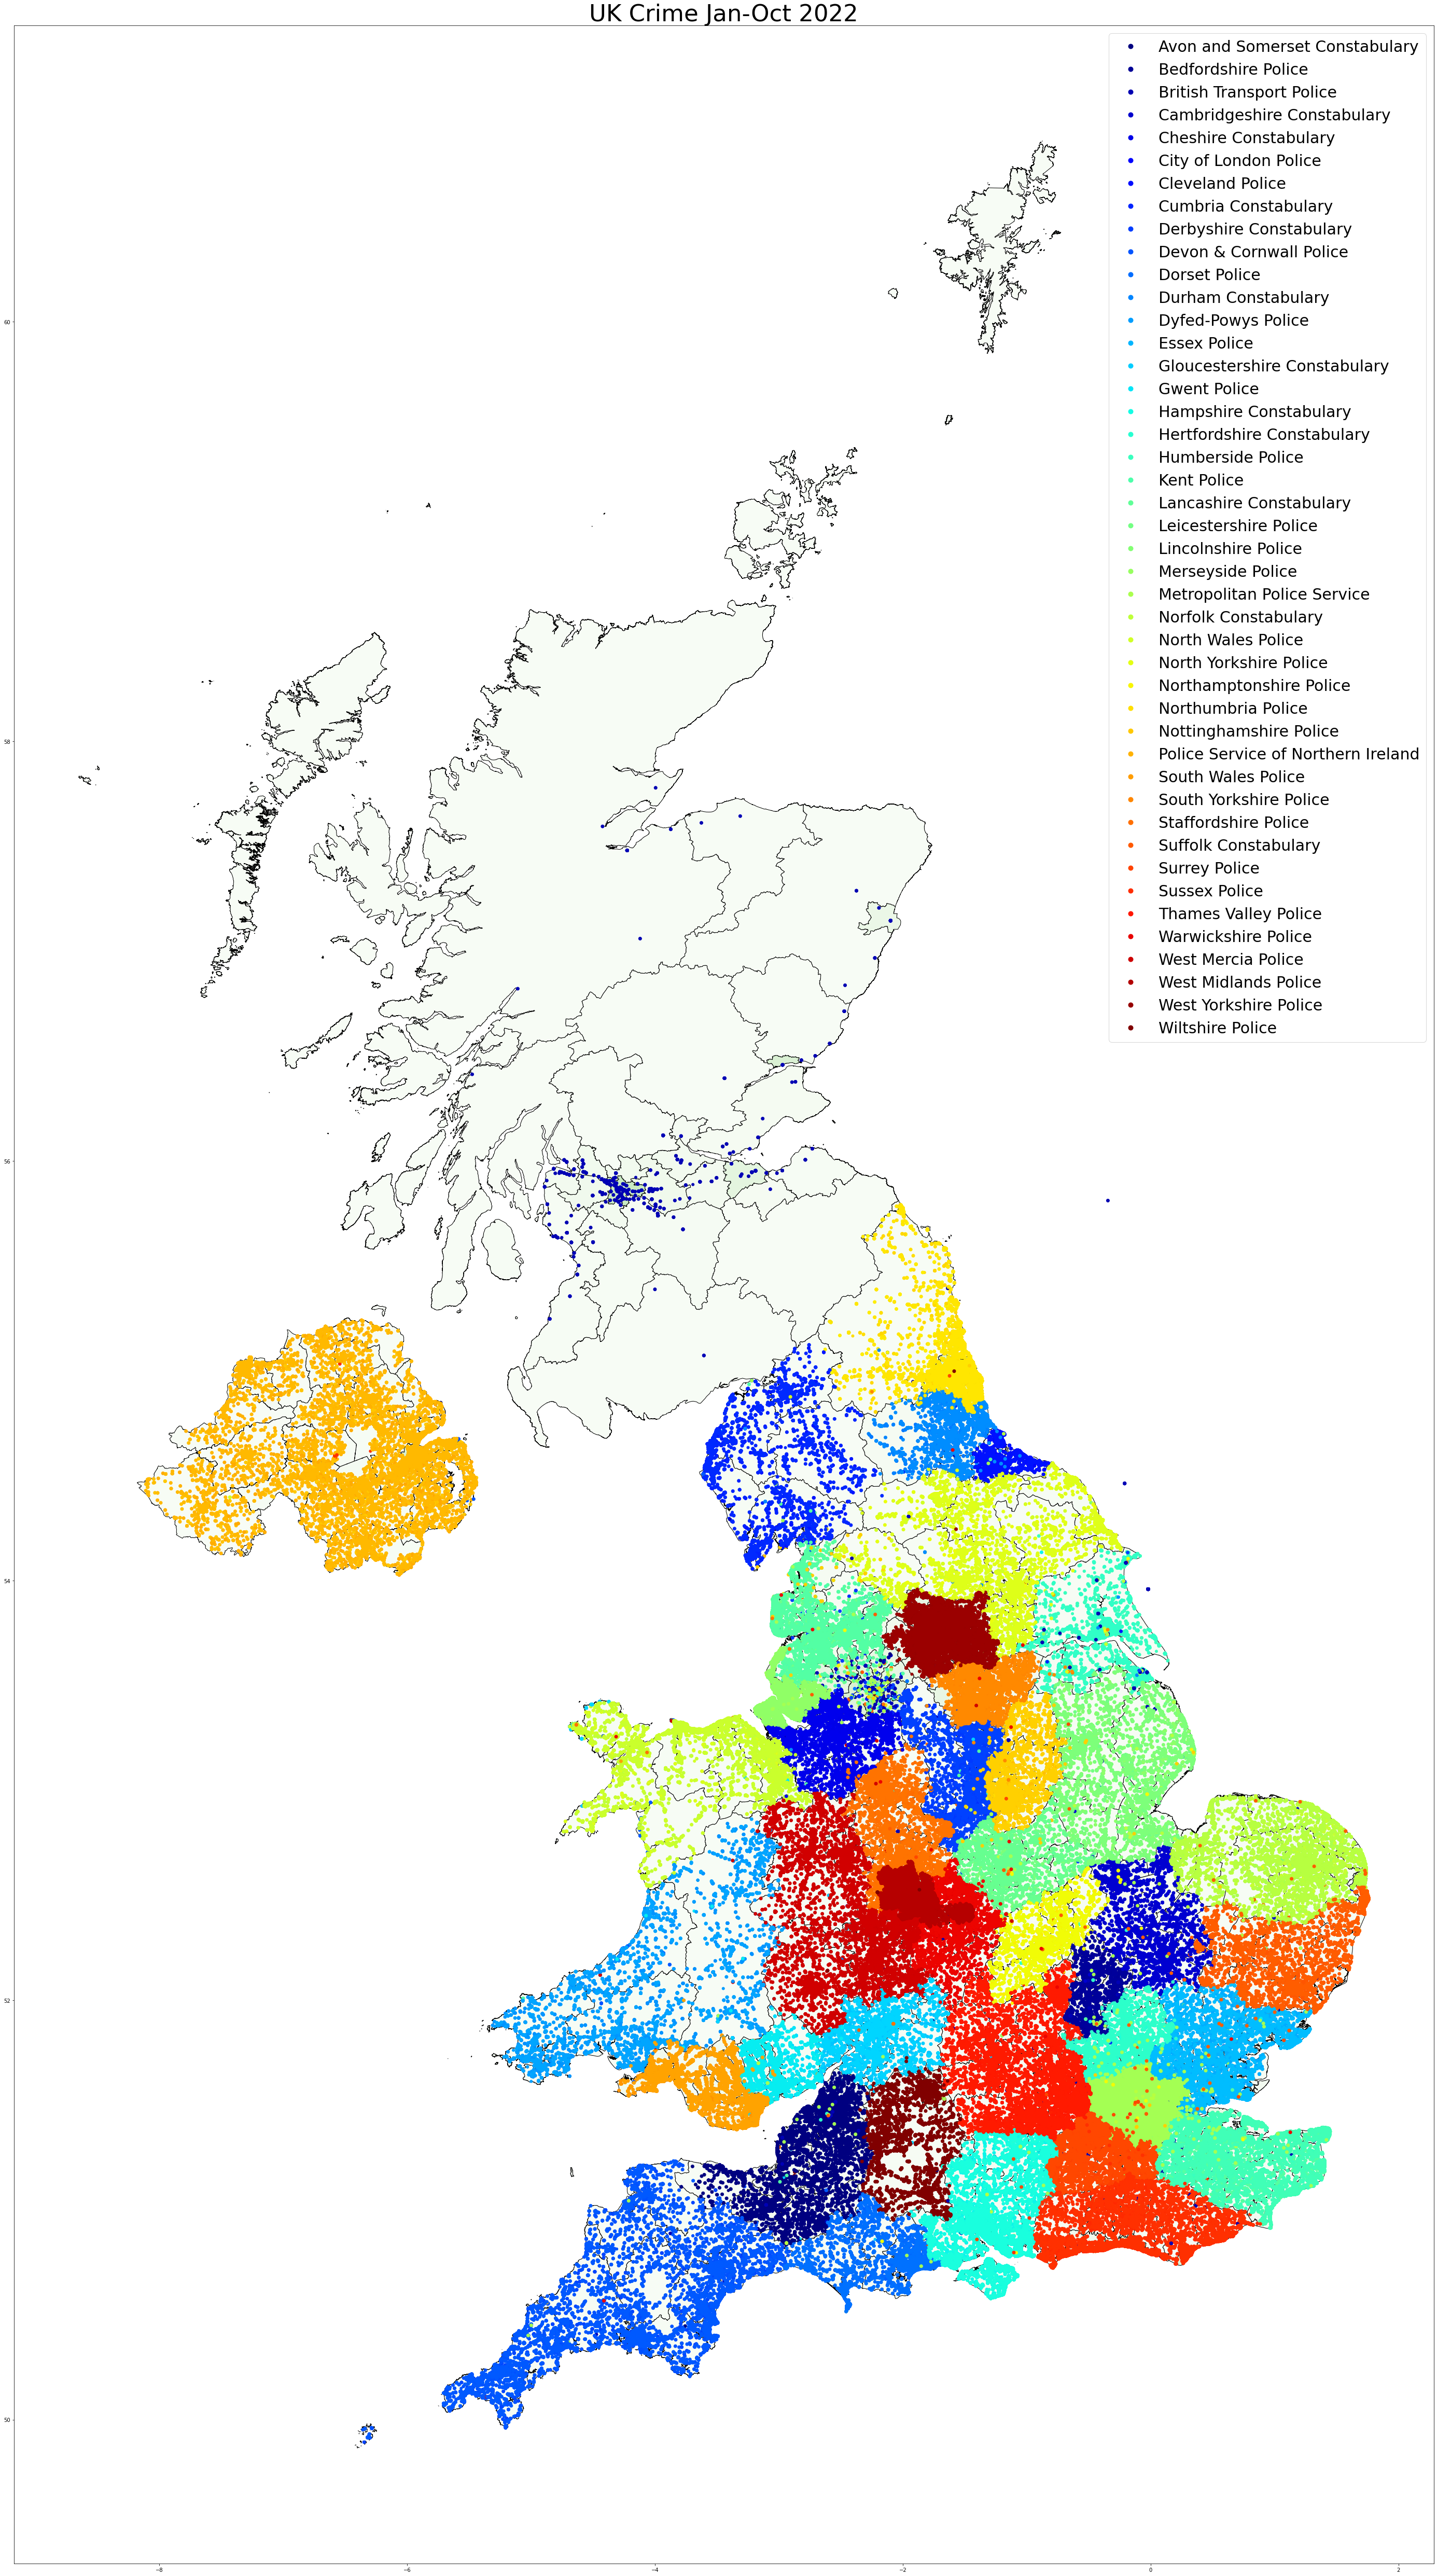
Constabularies Visualisation
Visualisation of figures as reported by
each individual constabulary.